Switch to: Español
Testing Results
TRACE-OSU held its last OSU-wide testing the week of June 7, 2021 (finals week). TRACE-OSU ends completely on June 30, 2021. The successor to TRACE-OSU, CTP (COVID Testing Program), will begin in the summer, under Dan Larson’s leadership. TRACE (the larger organization) will continue via TRACE-Community and TRACE-Center.
Testing
TRACE OSU tests students, faculty and staff at campuses in Corvallis and Bend and at the Hatfield Marine Science Center in Newport. Participation is voluntary and open to all current members of the OSU community who reside close enough to be tested. Individuals are randomly selected from each group to estimate the actual prevalence of the novel coronavirus in each location.
NOTE: The results below differ from those shown on OSU’s COVID-19 website, which include the weekly number of confirmed and presumptive COVID-19 cases as provided to the university by the Benton County Health Department involving students, faculty and staff affiliated with Oregon State University’s Corvallis campus. While the health department includes TRACE OSU data, the county’s numbers also include testing results and presumptive cases from other health-care providers in Benton County. TRACE OSU reports only results from the TRACE project.
Number of positive cases in the previous week (June 7-11)
0
students
living on or near Corvallis campus
0
faculty and staff
living on or near Corvallis campus
0
students and employees
living on or near OSU-Cascades
0
students and employees
living on or near HMSC
Number of tests completed in the previous week (June 7-11)
471
students
living on or near Corvallis campus
607
faculty and staff
living on or near Corvallis campus
54
students and employees
living on or near OSU-Cascades
69
students and employees
living on or near HMSC
Cumulative number of tests since the beginning of the program (as of June 4)
15,455
students
living on or near Corvallis campus
13,521
faculty and staff
living on or near Corvallis campus
1,247
students and employees
living on or near OSU-Cascades
1,634
students and employees
living on or near HMSC
Percentage of tests that were positive (as of June 11)
The number of positive test results divided by the total number of tests that were run during the previous fourteen calendar days.
0.14%
students
living on or near Corvallis campus
0%
faculty and staff
living on or near Corvallis campus
0%
students and employees
living on or near OSU-Cascades
0%
students and employees
living on or near HMSC
Prevalence
Prevalence is a leading indicator of the risk posed by the coronavirus in a community. Higher prevalence means that more people carry the virus, and therefore your risk of contracting it is higher. Prevalence is a statistical measure that takes into account sampling design, and reliability of the tests.
TRACE OSU prevalence estimate (for week of June 7-11)
An estimate of the fraction of the population who are infected with the virus during the week the samples were collected. Prevalence differs from percent positivity because it adjusts for factors such as the sampling design and reliability of the test. We report prevalence as the number of people in the population that are infected per 1000 individuals.
_*
in 1,000
OSU students living on or near Corvallis campus
_*
in 1,000
OSU faculty and staff living on or near Corvallis campus
_*
in 1,000
OSU students and employees living on or near OSU-Cascades
_*
in 1,000
OSU students and employees living on or near HMSC
* Because we observed 0 positive cases in this group this week, the point estimate for prevalence is 0. But because we know the true prevalence in the population is likely not 0, we avoid displaying a “0" and instead write the result as “—“
TRACE Community prevalence estimate
An estimate of the fraction of the population who are infected with the virus during the week the samples were collected. Prevalence differs from percent positivity because it adjusts for factors such as the sampling design and reliability of the test. We report prevalence as the number of people in the population that are infected per 1000 individuals.
13
in 1,000
in Corvallis on March 13 and 14, 2021
1
in 1,000
in Bend on May 30 and 31, 2020
5
in 1,000
in Eugene on November 7 and 8, 2020
32
in 1,000
in Redmond on January 29, 30, and 31, 2021
Wastewater sampling
Since all people who use toilet facilities contribute to wastewater flow, TRACE samples wastewater in communities and at OSU to complement individual testing. Wastewater provides another indication of the presence of the coronavirus in the region being sampled. Samples from wastewater in communities and OSU are analyzed at OSU.
OSU Wastewater scores
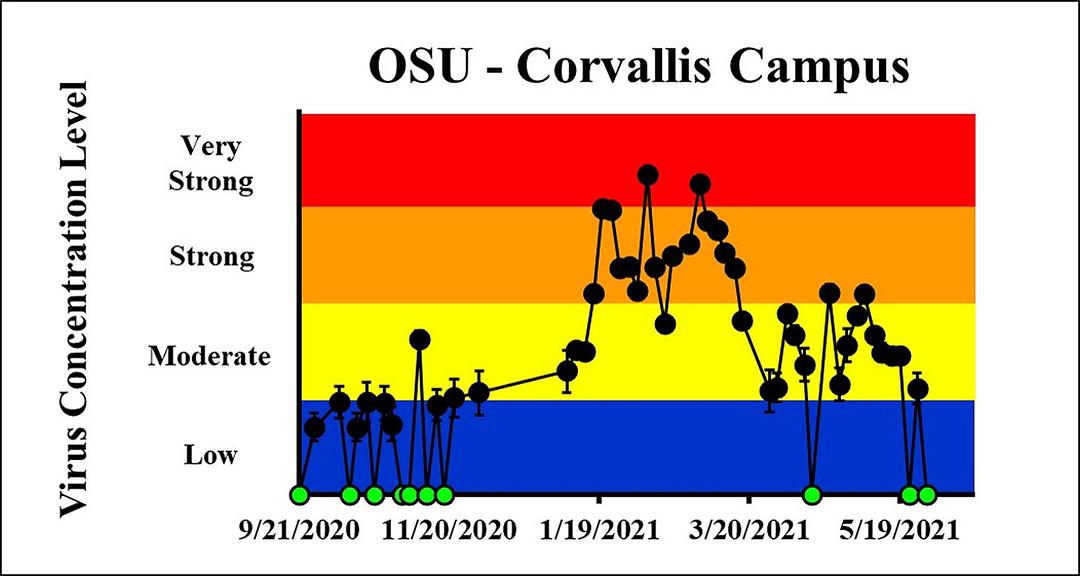
The data represented on this graph show the level and change in coronavirus concentrations found within wastewater collected at OSU, Corvallis Campus.
Higher concentrations suggest greater numbers of COVID-19 infections at that time on the Corvallis Campus, while lower concentrations suggest fewer COVID-19 infections. Green circles on the graph indicate that the concentration of the virus was so low that it was below the limit of detection in the wastewater sample.
Please note that the data on this chart are plotted on the log scale. This means that data points in the yellow “Moderate” zone are roughly 10 times greater than those in the blue “Low” zone. Similarly, data points in the orange “Strong” zone are roughly 10 times greater than those in the yellow “Moderate” zone and 100 times greater than those in the blue “Low” zone. Finally, data points in the red “Very Strong” zone are roughly 10 times greater than those in the orange “Strong” zone, 100 times greater than those in the yellow “Moderate” zone and 1,000 times greater than those in the blue “Low” zone. The latest sampling dates were 5/26/2021 and 5/30/2021.
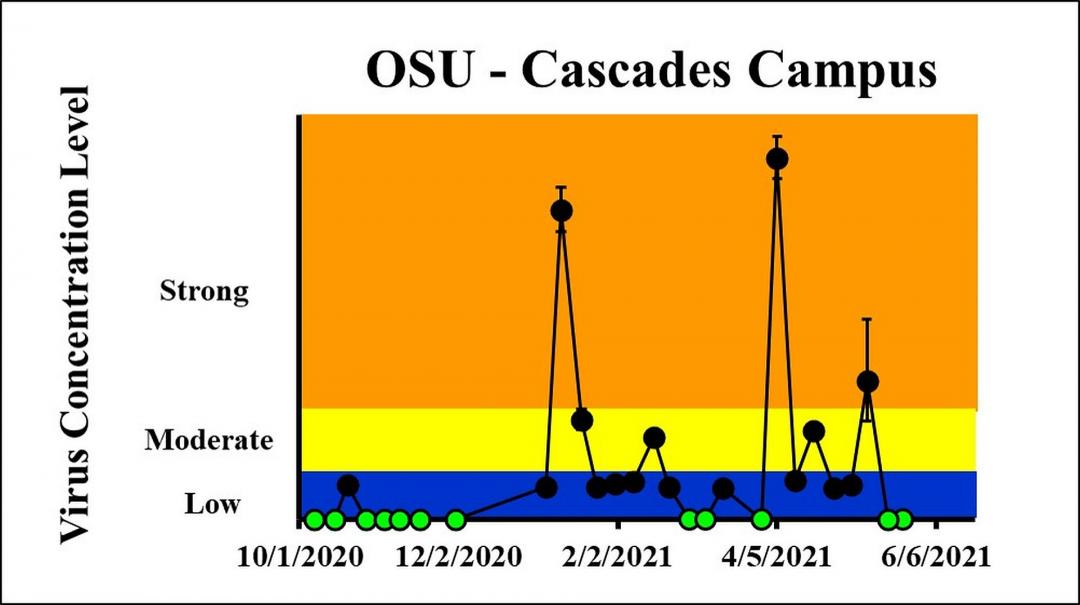
The data represented on this graph show the level and change in coronavirus concentrations found within wastewater collected at OSU-Cascades.
Higher concentrations suggest greater numbers of COVID-19 infections at that time on the OSU-Cascades campus, while lower concentrations suggest fewer COVID-19 infections. Green circles on the graph indicate that the concentration of the virus was so low that it was below the limit of detection in the wastewater sample. The latest sampling dates were 5/18/2021 and 5/24/2021.
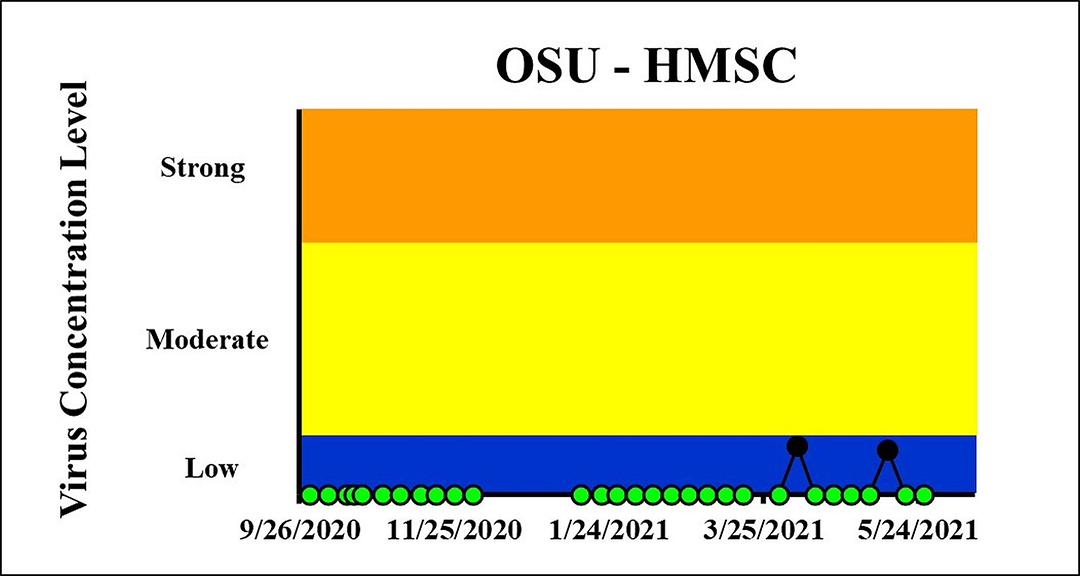
The data represented on this graph show the level and change in coronavirus concentrations found within wastewater collected at Hatfield Marine Science Center.
Higher concentrations suggest greater numbers of COVID-19 infections at that time at HMSC, while lower concentrations suggest fewer COVID-19 infections. Green circles on the graph indicate that the concentration of the virus was so low that it was below the limit of detection in the wastewater sample. The latest sampling dates were 5/19/2021 and 5/26/2021.
Community wastewater scores
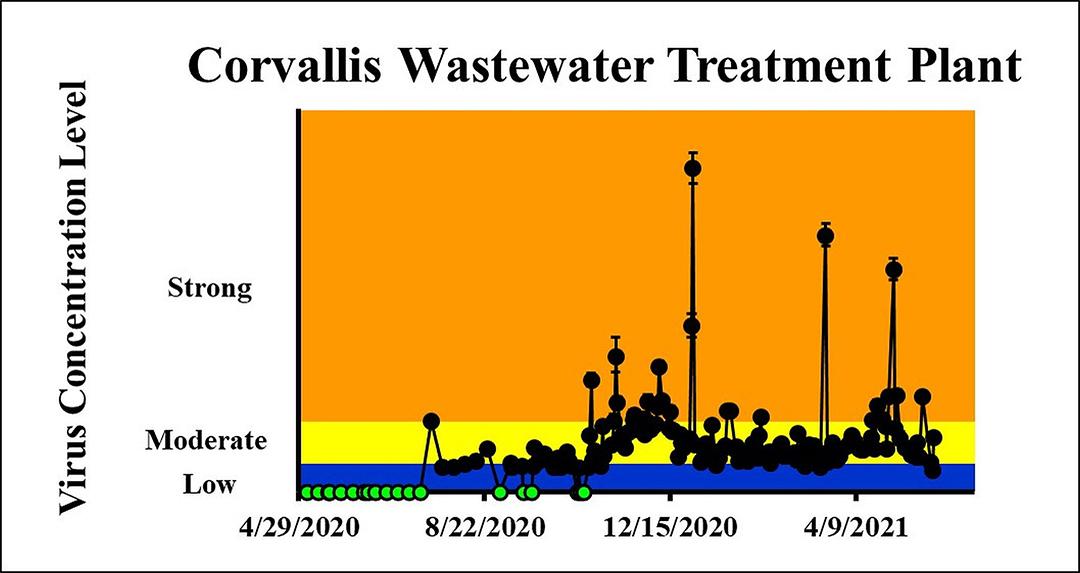
The data represented on this graph show the level and change in coronavirus concentrations found within wastewater collected from the city of Corvallis wastewater treatment plant.
Higher concentrations suggest greater numbers of COVID-19 infections at that time within the Corvallis community, while lower concentrations suggest fewer COVID-19 infections. Green circles on the graph indicate that the concentration of the virus was so low that it was below the limit of detection in the wastewater sample. The latest sampling dates were 5/26/2021 and 5/27/2021.
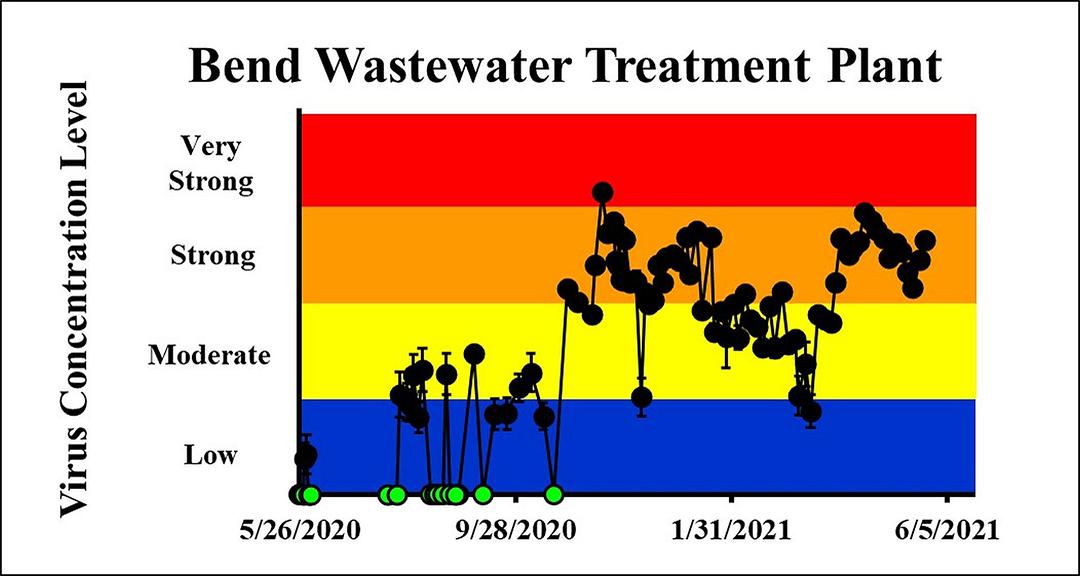
The data represented on the Bend graph show the level and change in coronavirus concentrations found within wastewater collected from the city of Bend wastewater treatment plant. Higher concentrations suggest greater numbers of COVID-19 infections at that time within the Bend community, while lower concentrations suggest fewer COVID-19 infections. Green circles on the graph indicate that the concentration of the virus was so low that it was below the limit of detection in the wastewater sample.
Please note that the data on this graph are plotted on the log scale. This means that data points in the yellow “Moderate” zone are roughly 10 times greater than those in the blue “Low” zone. Similarly, data points in the orange “Strong” zone are roughly 10 times greater than those in the yellow “Moderate” zone and 100 times greater than those in the blue “Low” zone. Finally, data points in the red “Very Strong” zone are roughly 10 times greater than those in the orange “Strong” zone, 100 times greater than those in the yellow “Moderate” zone and 1,000 times greater than those in the blue “Low” zone. The latest sampling dates were 5/20/2021 and 5/23/2021.
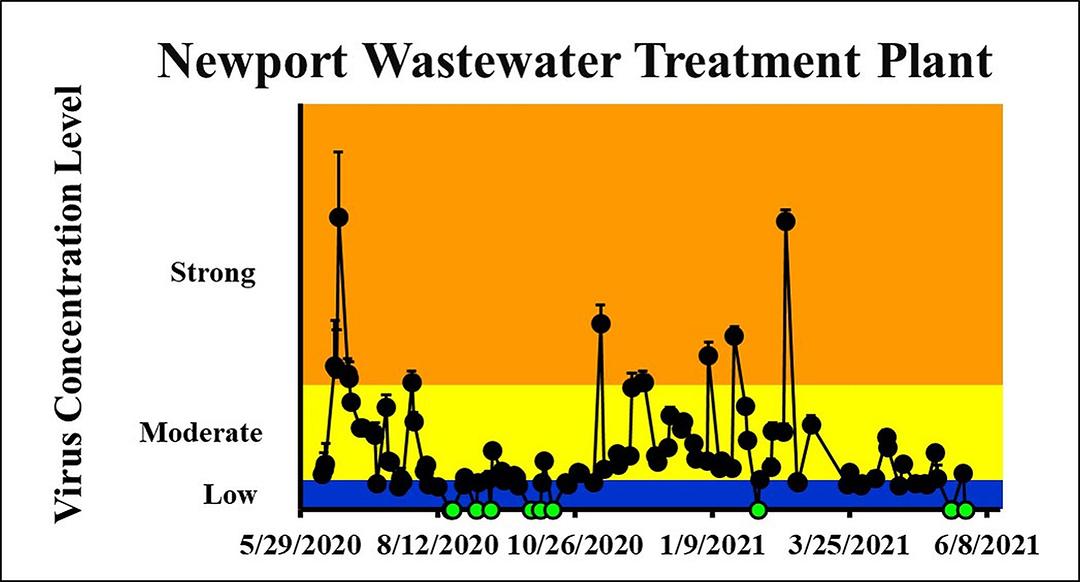
The data represented on this graph show the level and change in coronavirus concentrations found within wastewater collected from the city of Newport wastewater treatment plant.
Higher concentrations suggest greater numbers of COVID-19 infections at that time within the Newport community, while lower concentrations suggest fewer COVID-19 infections. Green circles on the graph indicate that the concentration of the virus was so low that it was below the limit of detection in the wastewater sample. The latest sampling dates were 5/26/2021 and 5/27/2021.